Electrocardiogram (ECG)
Definition
An Electrocardiogram (ECG) is a non-invasive diagnostic test that records the electrical activity of the heart over time using surface electrodes placed on the body. It reflects depolarization and repolarization of atrial and ventricular myocardium.
Key external reference:
https://radiopaedia.org/articles/electrocardiogram
https://www.ecgpedia.org/wiki/Main_Page
Indications
- Chest pain / suspected acute coronary syndrome
- Palpitations, syncope, presyncope
- Arrhythmia detection and monitoring
- Electrolyte abnormalities
- Drug toxicity (digoxin, antiarrhythmics)
- Structural heart disease screening
- Pre-operative assessment
ECG Leads and Views
Standard 12-Lead ECG
Limb Leads
- Lead I, II, III (Bipolar)
- aVR, aVL, aVF (Augmented unipolar)
Chest (Precordial) Leads
- V1–V6
Anatomical Correlation
| Leads | Area of Heart |
| ------------- | ----------------- |
| II, III, aVF | Inferior wall |
| I, aVL, V5–V6 | Lateral wall |
| V1–V4 | Anterior / Septal |
| V7–V9 | Posterior wall |
| V3R–V4R | Right ventricle |
Reference:
https://litfl.com/ecg-lead-positioning/
ECG Paper and Calibration
- Speed: 25 mm/sec
- Voltage: 10 mm = 1 mV
- 1 small square = 0.04 sec
- 1 large square = 0.20 sec
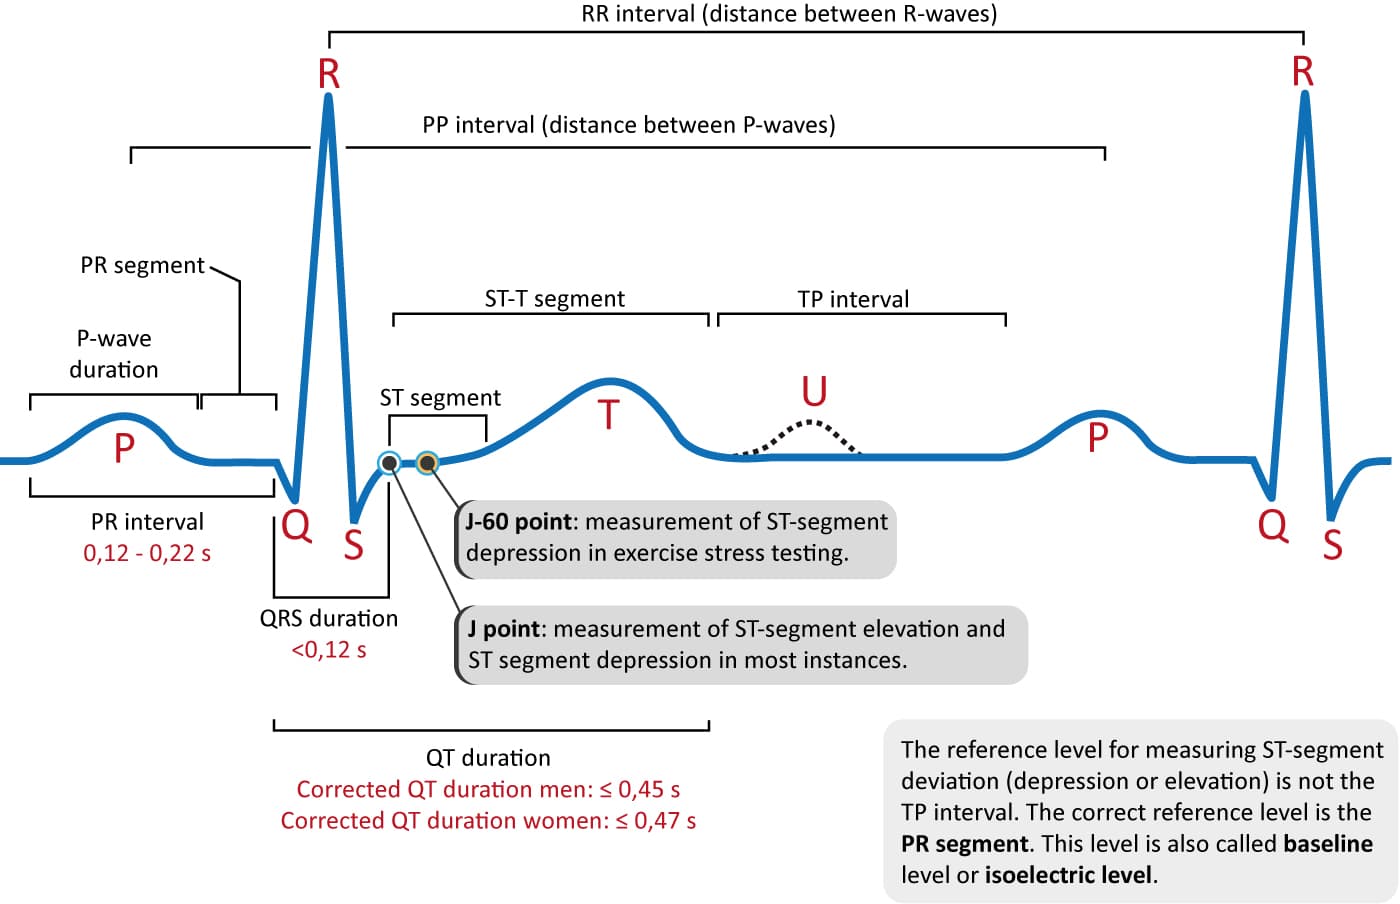
Normal ECG Waves and Intervals
P Wave
- Atrial depolarization
- Duration: <120 ms
- Height: <2.5 mm (lead II)
Abnormalities:
- Tall P → Right atrial enlargement
- Broad/notched P → Left atrial enlargement
Reference:
https://www.ecgpedia.org/wiki/P_wave
PR Interval
- AV nodal conduction
- Normal: 120–200 ms
Abnormal:
- Short PR → WPW syndrome
- Prolonged PR → First-degree AV block
QRS Complex
- Ventricular depolarization
- Normal duration: <120 ms
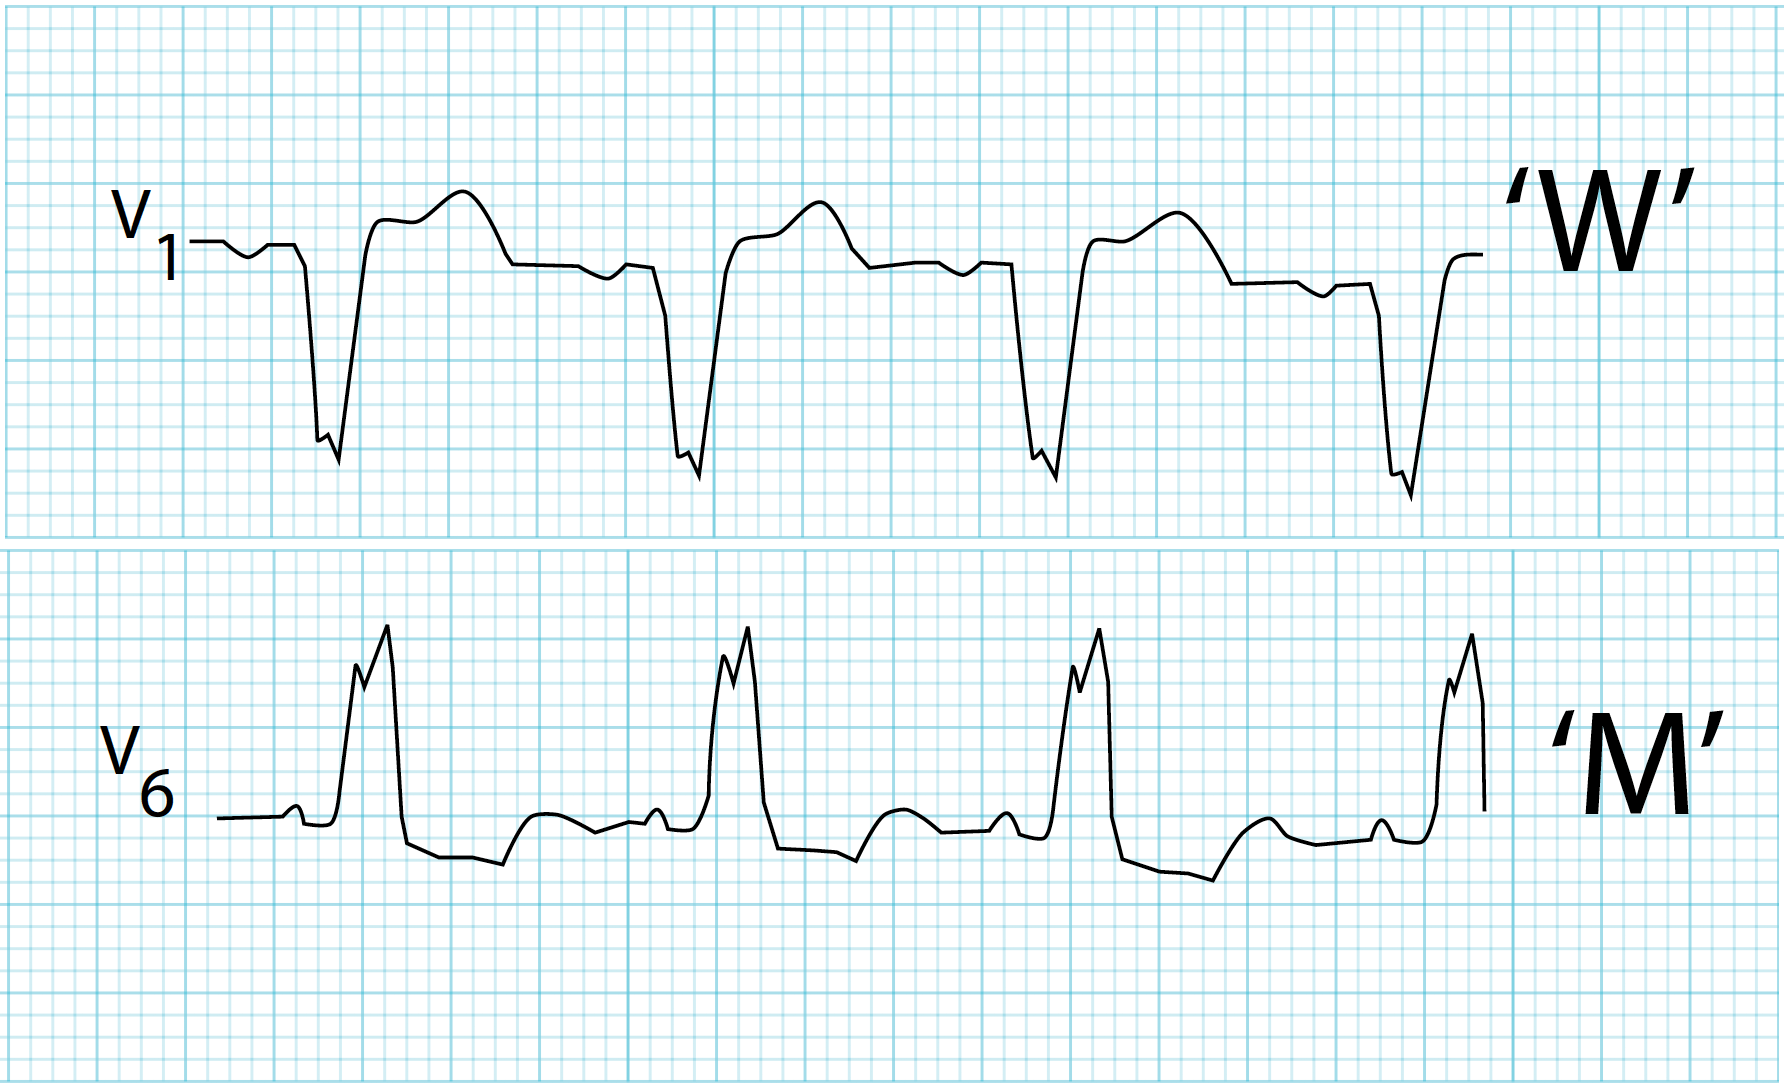
Wide QRS causes:
- Bundle branch block
- Ventricular rhythm
- Hyperkalemia
- Drug toxicity
ST Segment
- Normally isoelectric
- Elevation or depression indicates ischemia or injury
Reference:
https://litfl.com/st-segment-ecg-library/
T Wave
- Ventricular repolarization
- Inversion indicates ischemia, strain, CNS pathology
QT Interval
- Total ventricular depolarization + repolarization
- QTc (Bazett formula):
`
QTc = QT / √RR
`
Normal QTc:
- Male: <440 ms
- Female: <460 ms
Prolonged QT → risk of Torsades de Pointes
Reference:
https://litfl.com/qt-interval-ecg-library/
Systematic ECG Interpretation (STEPWISE)
1. Rate
- Regular rhythm: 300 ÷ large squares
- Irregular rhythm: count QRS in 10 sec × 6
2. Rhythm
- Sinus rhythm: P before every QRS, upright P in II
- Irregularly irregular → Atrial fibrillation
3. Axis
- Normal: −30° to +90°
- Left axis deviation → LBBB, LVH
- Right axis deviation → RBBB, PE
Reference:
https://litfl.com/ecg-axis-interpretation/
4. Intervals
- PR, QRS, QTc evaluation
5. Hypertrophy Patterns
Left Ventricular Hypertrophy
- S(V1) + R(V5/V6) > 35 mm
Right Ventricular Hypertrophy
- R/S > 1 in V1
6. Ischemia and Infarction
STEMI Criteria
- ST elevation ≥1 mm in ≥2 contiguous leads
- New LBBB with symptoms
NSTEMI
- ST depression, T inversion, positive troponin
Reference:
https://www.escardio.org/Guidelines
Common ECG Arrhythmias
Atrial Fibrillation
- No P waves
- Irregularly irregular rhythm
Atrial Flutter
- Saw-tooth flutter waves
- Ventricular rate often 150 bpm
Ventricular Tachycardia
- Wide QRS tachycardia
- AV dissociation
Ventricular Fibrillation
- Chaotic waveform
- Cardiac arrest rhythm
Reference:
https://litfl.com/ecg-library/
ECG in Electrolyte Abnormalities
| Electrolyte | ECG Changes |
| ------------- | ---------------------------------- |
| Hyperkalemia | Tall tented T, wide QRS, sine wave |
| Hypokalemia | U waves, flat T |
| Hypercalcemia | Short QT |
| Hypocalcemia | Prolonged QT |
Reference:
https://radiopaedia.org/articles/electrolyte-disturbances-on-ecg
ECG in Drug Toxicity
Digoxin
- Scooped ST depression
- Atrial tachycardia with block
Tricyclic Antidepressants
- Wide QRS
- Right axis deviation
Special ECG Patterns
- Brugada syndrome: Coved ST elevation V1–V3
- WPW: Short PR, delta wave
- Pericarditis: Diffuse ST elevation, PR depression
- Pulmonary embolism: S1Q3T3 pattern
Reference:
https://radiopaedia.org/articles/brugada-syndrome
Limitations of ECG
- Can be normal in early ischemia
- Poor sensitivity for posterior MI without additional leads
- Electrical activity does not always equal mechanical function